Content
Master the Hotel Industry KPI to Boost Your Hotel's Performance

In the hotel business, you can't manage what you don't measure. That's where Key Performance Indicators, or KPIs, come in. These are the specific, measurable data points that tell you exactly how your hotel is performing. Think of metrics like Average Daily Rate (ADR) and Occupancy Rate—they give you a clear view of your financial health, how smoothly things are running, and whether your guests are happy. Ultimately, they empower you to make decisions based on solid data, not just guesswork. Need help sorting through your data? You can always schedule a free 30-minute consultation on my Calendly.
Why Hotel KPIs Are Your Navigational Chart
Ever tried to steer a ship across the ocean without a compass or a map? You'd be adrift, completely at the mercy of the currents. Running a hotel without tracking your KPIs is the same thing—you're essentially flying blind, relying on gut feelings to make critical business decisions.
A hotel industry kpi isn't just another number on a spreadsheet; it’s a vital sign for your business. These metrics are your navigational tools, piecing together the complete story of your hotel's performance. They turn vague goals like "increase revenue" into tangible, measurable targets.
Think of KPIs not as cold, hard numbers, but as vital signs that show you where you're succeeding and where you need to adjust course to stay competitive and profitable.
Of course, great navigation also depends on a well-built ship. This is where robust operational systems, like modern hotel PMS integration solutions, become indispensable. A good PMS acts as the central nervous system for your hotel, gathering all the raw data that fuels your KPI analysis in one place.
The Core of Hotel Performance Measurement
At their heart, KPIs help you answer the make-or-break questions about your business:
Are our pricing strategies actually working?
How well are we filling our available rooms?
Are our guests satisfied enough to come back or recommend us to others?
Are we truly profitable once all the costs are factored in?
To get a clearer picture, it helps to group these metrics into a few key areas.
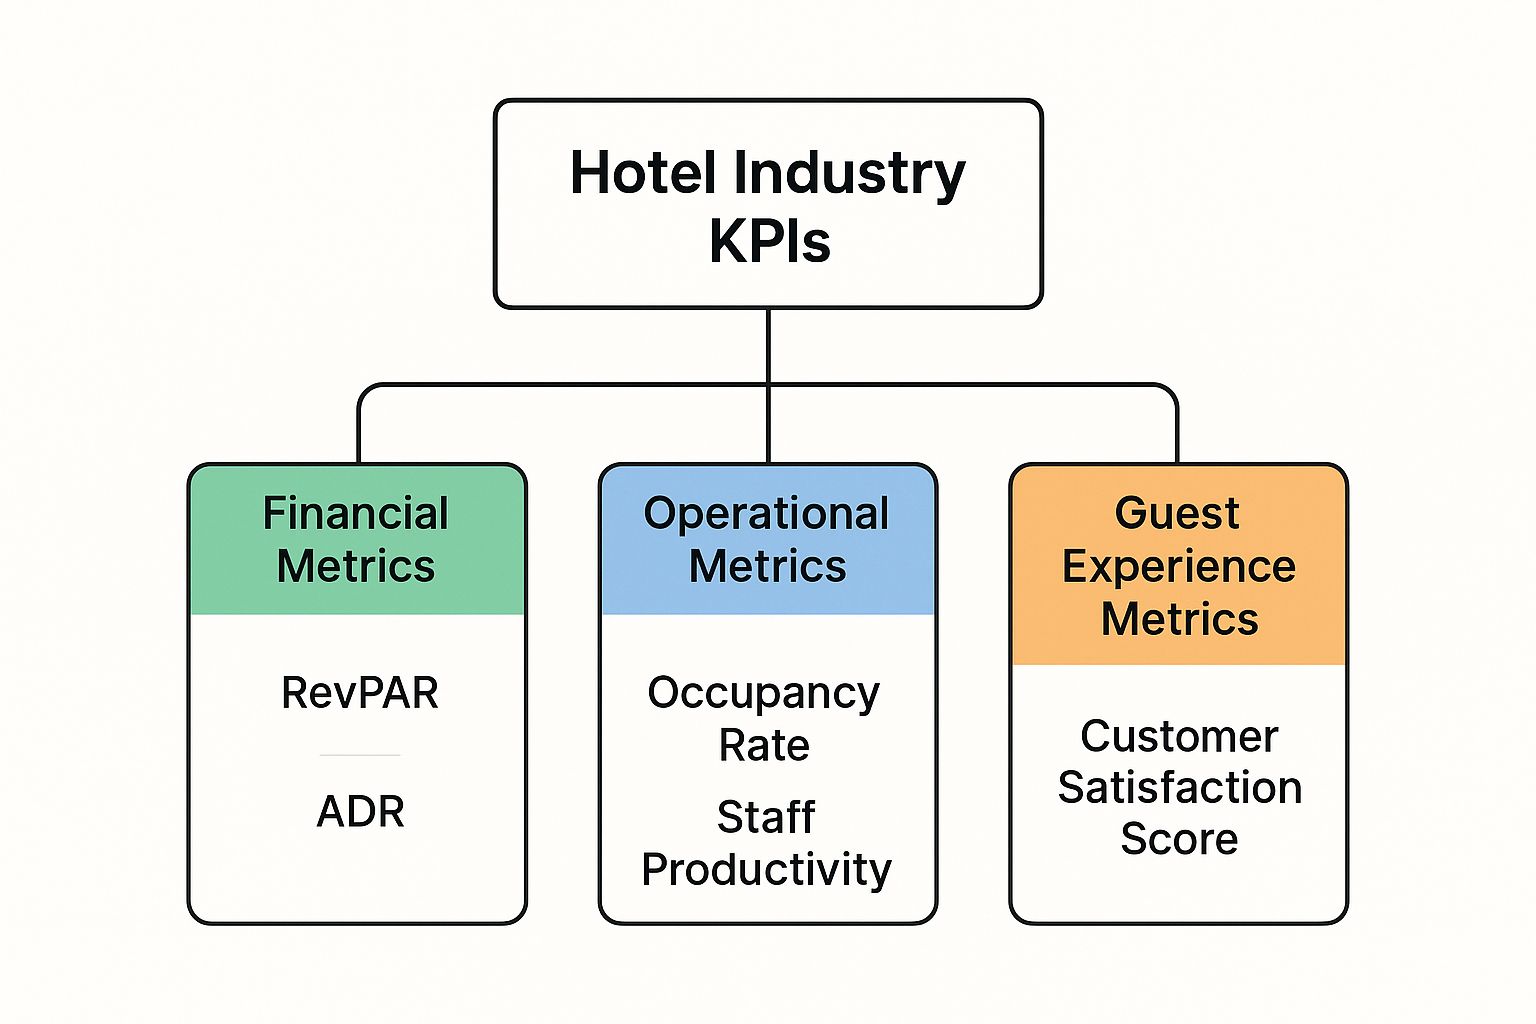
As you can see, the metrics all connect. Your financial health is tied directly to your operational efficiency and guest satisfaction. By monitoring all three, you can make smarter, more balanced decisions that drive growth across the board.
Understanding Current Industry Trends
Keeping a close eye on these metrics is more important than ever, especially given what's happening in the market right now. We're seeing a significant upward trend for the Average Daily Rate (ADR), largely fueled by a powerful resurgence in travel demand.
Globally, hotel occupancy rates are expected to hold steady between 68% and 70%. This stability, combined with higher room rates, is projected to lift Revenue Per Available Room (RevPAR) by an estimated 3% worldwide. These are the benchmarks you're up against.
Mastering these core metrics is the first step. Once you do, you can start turning raw data into a powerful strategy for success.
2. Understanding Your Average Daily Rate (ADR)
Out of all the numbers you track, your Average Daily Rate (ADR) is one of the most straightforward yet powerful metrics. Think of it as the purest measure of your hotel's daily earning power from room sales alone. It answers a simple, crucial question: on average, how much did we make from each room we sold today?
The calculation itself couldn't be easier.
Formula: ADR = Total Room Revenue / Number of Rooms Sold
Notice what's not in that formula. ADR ignores unsold rooms, and it doesn't factor in what guests spend on food, drinks, or spa treatments. It laser-focuses on the revenue generated exclusively from occupied rooms, making it the perfect benchmark for your pricing strategy.
A Real-World Example
Let’s bring this to life. Imagine you run a trendy 50-room boutique hotel. Yesterday was a solid day—you sold 45 rooms and brought in $15,750 in total room revenue.
Here's how you'd find your ADR:
$15,750 (Total Room Revenue) ÷ 45 (Rooms Sold) = $350 ADR
So, on average, each occupied room generated $350. That’s your number. But this immediately leads to the big question: Is a $350 ADR good?
Honestly, the answer is "it depends." For a mid-range airport hotel, $350 would be phenomenal. For a five-star luxury resort in a prime location, it might be a sign of trouble. The value of your ADR is always relative to your specific market, competitors, and hotel type.
How to Use ADR Strategically
Knowing your ADR is one thing; using it to make smarter decisions is where the real magic happens. A consistently high ADR tells you that guests see real value in what you offer and are happy to pay your rates. A dipping ADR, however, can be an early warning that you’re losing ground to competitors or that your pricing is out of sync with current demand.
To get the most out of this metric, you have to look at it from different angles:
Competitor Benchmarking: How does your ADR stack up against your direct competitors? If they're all averaging $375, it might be time to test a price increase.
Seasonality and Events: Do you see a spike during the summer holidays or when a big conference is in town? Tracking these trends helps you build a more dynamic and profitable pricing calendar.
Day of the Week: Are your weekend rates carrying the business? If so, you can start creating targeted promotions to fill more rooms mid-week.
By keeping a close eye on your ADR and the factors influencing it, you turn a simple calculation into a powerful strategic tool. This foundational knowledge is just one piece of the puzzle, and you can see how it connects with other key metrics in our complete guide on https://www.ranova.ai/blog/kpis-for-hotel-industry. Mastering this helps you fine-tune your pricing, stay competitive, and ultimately drive more revenue. For personalized advice, feel free to book a consultation on my Calendly.
Using Occupancy Rate to Understand Demand
Your Average Daily Rate (ADR) tells you what people are willing to pay, but an empty room brings in exactly zero dollars, no matter how high your posted rate is. This is why Occupancy Rate is one of the most fundamental hotel industry KPIs. It’s the metric that shows you, plain and simple, how well you’re filling your property and capturing the demand that's out there.
Think of it as the percentage of your available rooms that were actually sold on a given night. It’s a direct, no-nonsense snapshot of your hotel’s performance and its ability to attract guests.
Formula: Occupancy Rate = (Number of Rooms Occupied / Total Number of Available Rooms) x 100
It’s a straightforward calculation, but it reveals so much. If you have 100 rooms available and sold 85 of them last night, your Occupancy Rate is 85%. This metric is the perfect counterpart to ADR; one tells you about price, the other tells you about volume.
Balancing Occupancy and Profitability
A high Occupancy Rate feels great, but it’s only half the story. The real goal isn't just to fill rooms—it's to fill them profitably. This is the tightrope every hotel manager walks every single day.
It's tempting, especially during slow periods, to slash your rates just to get that occupancy number up to 100%. But this strategy can quickly turn into a "race to the bottom," hurting your brand's reputation and eating away at your profit margins.
For example, selling out at a $99 rate might look impressive on the daily report, but it could easily bring in less total revenue than hitting 85% occupancy at a much healthier $150 rate. True success is found in that sweet spot where you maximize the number of heads in beds without giving away the farm on your ADR. Mastering this balance is the secret to strong, sustainable growth.
The market is always changing, and you need to keep an eye on the bigger picture to set realistic occupancy goals. With global room demand projected to grow and thousands of new hotels in the pipeline, the competition is getting tougher. You can discover more hospitality industry statistics to get a feel for how these dynamics are playing out and how they might impact your specific location.
How External Factors Influence Your Occupancy
Your Occupancy Rate doesn't exist in a bubble. It's constantly being pushed and pulled by outside forces, and being aware of them is crucial for making smart decisions.
Seasonality: Are you a beach resort that comes alive in the summer or a ski lodge that's booked solid in the winter? Knowing your natural demand cycles is the foundation for any good occupancy strategy.
Local Events: That big annual conference, a huge music festival, or a major sporting event can send demand through the roof. If you see these on the calendar, you can adjust your rates and marketing to make the most of the temporary surge.
Economic Conditions: When people feel good about the economy, they travel more. Broader trends in consumer confidence and disposable income will always have a direct impact on your bookings.
By looking at your Occupancy Rate through the lens of these external factors, you can stop just reacting to your numbers and start actively shaping your hotel’s success. Need help digging into your data to find that perfect balance? I can help you build a smarter KPI strategy—schedule a free 30-minute consultation on my Calendly.
How RevPAR Tells Your Complete Financial Story
Think of it this way: if your Average Daily Rate (ADR) is your pricing power and your Occupancy Rate is a measure of demand, then Revenue Per Available Room (RevPAR) is where these two heavyweights meet. It gives you the most complete picture of how well your hotel is turning its most valuable asset—its rooms—into cold, hard cash.
RevPAR answers the one question every hotelier needs to know: How much revenue is each room generating, whether it was occupied or sat empty? This is what makes it, in my experience, the single most powerful hotel industry KPI. While ADR only considers the rooms you sold, RevPAR looks at your entire inventory, providing a much more honest assessment of your financial health by blending your pricing strategy with your sales volume.
The Two Paths to Calculating RevPAR
You can get to this critical number in two ways. Both are simple, and both will give you the same essential insight into your performance.
The Blended Approach:
RevPAR = Average Daily Rate (ADR) x Occupancy RateThe Total Revenue Approach:
RevPAR = Total Room Revenue / Total Available Rooms
I find the first method is great for a quick gut check on how well your pricing and occupancy efforts are working together. The second formula draws a straight line from your total top-line revenue right down to a single room's contribution. Either way, you get a clear view of how effectively you're monetizing your inventory.
Why RevPAR Is More Than the Sum of Its Parts
So, why does this matter so much? Because looking at ADR or Occupancy in a vacuum can be incredibly misleading. Let’s imagine two competing 100-room hotels.
Hotel A (The High-Rate Specialist): They command a premium ADR of $250, but they only manage to fill 60% of their rooms on an average night.
Hotel B (The Volume Player): They opt for a more competitive ADR of $180 but keep the hotel bustling with a 90% Occupancy Rate.
If you only looked at ADR, you'd think Hotel A was the clear winner. But let's run the RevPAR numbers and see who's really making more money.
Hotel A RevPAR: $250 (ADR) x 60% (Occupancy) = $150 Hotel B RevPAR: $180 (ADR) x 90% (Occupancy) = $162
There it is. Despite a significantly lower room rate, Hotel B is actually earning $12 more per available room, every single day. That's the power of RevPAR in action. It cuts through the noise and reveals performance gaps that other metrics can easily hide.
This is the kind of insight that helps you make smarter decisions. You can benchmark accurately against competitors and immediately diagnose whether your problem is pricing or volume. Are your rates scaring people away, or is your marketing just not bringing enough people through the door? RevPAR helps you figure that out. To really get a handle on this and other key metrics, it's worth exploring a dedicated hotel KPI dashboard to see all your data in one place.
Measuring Success Beyond Room Revenue

While RevPAR gives you a powerful snapshot of your room-related income, it's only one piece of the puzzle. A truly successful hotel is an ecosystem of experiences. Guests dine in your restaurant, unwind at the spa, grab a drink at the bar, or rent out your conference facilities. If you only focus on room revenue, you’re missing a huge part of the story—and a lot of potential profit.
To get the full financial picture, you need to think bigger. This means adopting a hotel industry KPI that accounts for every dollar a guest spends on your property. This is where more sophisticated metrics come in, shifting the focus from just revenue to total profitability and the long-term health of your business.
Total Revenue Per Available Room (TRevPAR)
Think of Total Revenue Per Available Room (TRevPAR) as RevPAR’s more comprehensive older sibling. It bundles up all the revenue your hotel generates—rooms, food and beverage, meeting spaces, parking, you name it—and then divides that total by the number of rooms you have available.
Formula: TRevPAR = Total Hotel Revenue / Total Available Rooms
Why does this matter so much? Because TRevPAR shows you how effectively you're monetizing your entire property, not just the bedrooms. When your TRevPAR is climbing, it’s a clear sign that your other amenities are pulling their weight and contributing directly to the bottom line. It proves that every department, from the front desk to the kitchen, plays a crucial role in your overall success.
This holistic view is more important than ever. As guest spending on hotel services and local experiences continues to rise, TRevPAR becomes the go-to metric for capturing that value. You can see the full report on hotel economic impact to get a sense of just how significant this trend has become.
Gross Operating Profit Per Available Room (GOPPAR)
So, TRevPAR tells you how much money is coming in. But Gross Operating Profit Per Available Room (GOPPAR) tells you what you actually get to keep. This metric is all about profitability. It takes your total revenue, subtracts your operational expenses, and then divides that final number by your available rooms.
It answers the most important question for any hotelier: After paying for staff, supplies, utilities, and all the other costs of doing business, how much profit are we really making per room?
GOPPAR provides an honest, clear-eyed look at your operational efficiency. A strong GOPPAR is the ultimate sign of a healthy business—it shows you're not just a revenue-generating machine, but you're also brilliant at managing your costs. That's the foundation of a truly sustainable hotel.
Essential KPIs for Long-Term Health
Beyond the core financial metrics, a few other indicators are vital for building a resilient hotel that thrives for years to come. These KPIs zero in on guest loyalty and how efficiently you acquire new business.
Guest Satisfaction Scores: Often tracked using the Net Promoter Score (NPS), this KPI measures how likely guests are to recommend your hotel to friends and family. It’s a direct reflection of their experience and a powerful predictor of repeat business.
Direct Booking Percentage: This is a simple but critical metric. It calculates the percentage of bookings coming through your own website or phone number, as opposed to third-party Online Travel Agencies (OTAs). More direct bookings mean you pay less in commissions, which translates directly to higher profit margins.
By keeping an eye on this wider set of KPIs, you gain a 360-degree view of your business performance. If you'd like a hand building a dashboard that brings this complete picture into focus, feel free to book a complimentary 30-minute consultation with me on Calendly to go over your strategy.
Turning KPI Insights Into Actionable Strategies
Knowing your numbers is one thing; knowing what to do with them is everything. The real value of any hotel industry kpi isn't just in the number itself, but in how you translate that insight into smarter strategies that improve your hotel's performance.
This is where you move from being a scorekeeper to a game-changer. Think of your KPI dashboard as a diagnostic tool. A sudden dip in RevPAR isn't just a statistic to report—it's a flashing light telling you to dig deeper. Did our ADR get too ambitious for the slow season? Or is our Occupancy Rate taking a hit because a new competitor is running a promotion down the street? The answers are always in the data.
By building a data-driven culture, every team member—from the front desk to housekeeping—can understand how their daily actions directly contribute to key metrics, turning insights into a shared mission for excellence.
From Data Points to Strategic Plays
Transforming raw data into effective action is about connecting the dots. You have to bridge the "what" (the KPI value) with the "why" (the cause) and, most importantly, the "how" (the solution).
For example, if your Direct Booking Ratio is disappointingly low, the goal isn't just a vague "get more direct bookings." The real play is to launch a targeted campaign offering a small, exclusive perk—like a complimentary drink—for booking through your website. Or maybe it's time to overhaul your site’s clunky user experience.
And while financial metrics often steal the show, don't underestimate the power of operational excellence. Things like improving cleanliness as a business driver in short-term rentals can have a massive, direct impact on guest satisfaction scores, which in turn drives repeat business and boosts your bottom line.
Ultimately, using KPIs proactively means you're not just looking in the rearview mirror. You're building a roadmap for a more profitable future by setting realistic targets, benchmarking against the right competitors, and always asking what story the numbers are telling. For a closer look at this, our guide on mastering hospitality service excellence breaks down how operational tweaks fuel overall performance.
Ready to turn your data into a clear strategy? Let's discuss how to optimize your hotel's performance. You can book a complimentary 30-minute consultation with me on Calendly.
Got Questions About Hotel KPIs? We’ve Got Answers.
Jumping into the world of hotel KPIs can feel like learning a new language. You've got acronyms and formulas flying around, and it's natural to have questions. Getting clear, simple answers is the first step to turning all that data into smart, confident decisions that actually move the needle. You can always ask me directly by scheduling a free consultation on Calendly.
Let's tackle some of the most common questions we hear from hoteliers.
What Is the Most Important Hotel KPI?
This is the big one, and if you ask a dozen hotel managers, you might get a few different answers. But most seasoned experts will point you toward one metric in particular: Revenue Per Available Room (RevPAR).
Why RevPAR? It’s the ultimate hybrid metric. It beautifully blends your pricing strategy (your Average Daily Rate, or ADR) with your ability to sell rooms (your Occupancy Rate). Think of it as a single score that tells you how well you're monetizing your entire property, not just the rooms you sold. A strong RevPAR is a clear sign that your sales and pricing strategies are in sync and firing on all cylinders.
How Often Should I Be Checking My Hotel KPIs?
There’s no single right answer here—it all depends on what you’re measuring and why. The key is to match your tracking frequency to the speed of your operations.
Check Daily: Your core operational numbers, like Occupancy Rate and ADR, need a daily look. This is your ground-level view, allowing you to make quick adjustments to pricing or availability based on what’s happening right now.
Review Weekly & Monthly: Bigger picture financial metrics, like RevPAR and GOPPAR, are best analyzed on a weekly and monthly basis. This rhythm helps you spot trends, see if your strategies are paying off, and plan for the months ahead.
Monitor in Real-Time: Anything guest-related, especially satisfaction scores and online reviews, should be watched continuously. Immediate feedback requires immediate action to protect your online reputation and show guests you’re listening.
The goal is to find a balance. You need to be in the weeds enough to react quickly, but you also need to zoom out regularly to see the larger strategic landscape.
What Are Some Simple Ways to Improve My RevPAR?
Improving RevPAR always boils down to pulling one of two levers: you either increase your average room rate (ADR) or you get more heads in beds (Occupancy). The magic happens when you can do both at the same time.
For instance, you could implement a dynamic pricing strategy that automatically raises rates as demand climbs for specific dates. Another great approach is to focus on upselling guests to premium rooms or creating unique packages that bundle a room with dinner, spa credits, or a local tour. These value-added offers not only make a stay more attractive, boosting occupancy, but they also justify a higher price point. It’s a classic win-win.
Ready to turn these KPI insights into a powerful reputation and revenue strategy? Ranova helps hotels act on guest feedback to improve scores and drive growth. Discover how our AI-powered platform can work for you by booking a complimentary 30-minute consultation on Calendly.