

KPI for Hotels: Key Metrics to Boost Your Hotel Performance
June 13, 2025

Understanding Hotel KPIs: Your Property's Health Dashboard
Think of your hotel's Key Performance Indicators (KPIs) like the dashboard of your car. It tells you everything you need to know about how your property is performing – from fuel efficiency (profitability) to engine health (guest satisfaction). Many hoteliers glance at the speedometer (occupancy) and think they have the full picture. But true success lies in understanding the nuances of the entire dashboard. Ignoring critical indicators can lead to costly mistakes down the road.
Imagine focusing solely on filling every room, neglecting the average rate you're charging. You might achieve high occupancy but at the expense of profitability. Sophisticated KPIs act like your GPS, providing real-time insights and helping you anticipate market changes. This allows you to adjust your strategy before you veer off course.
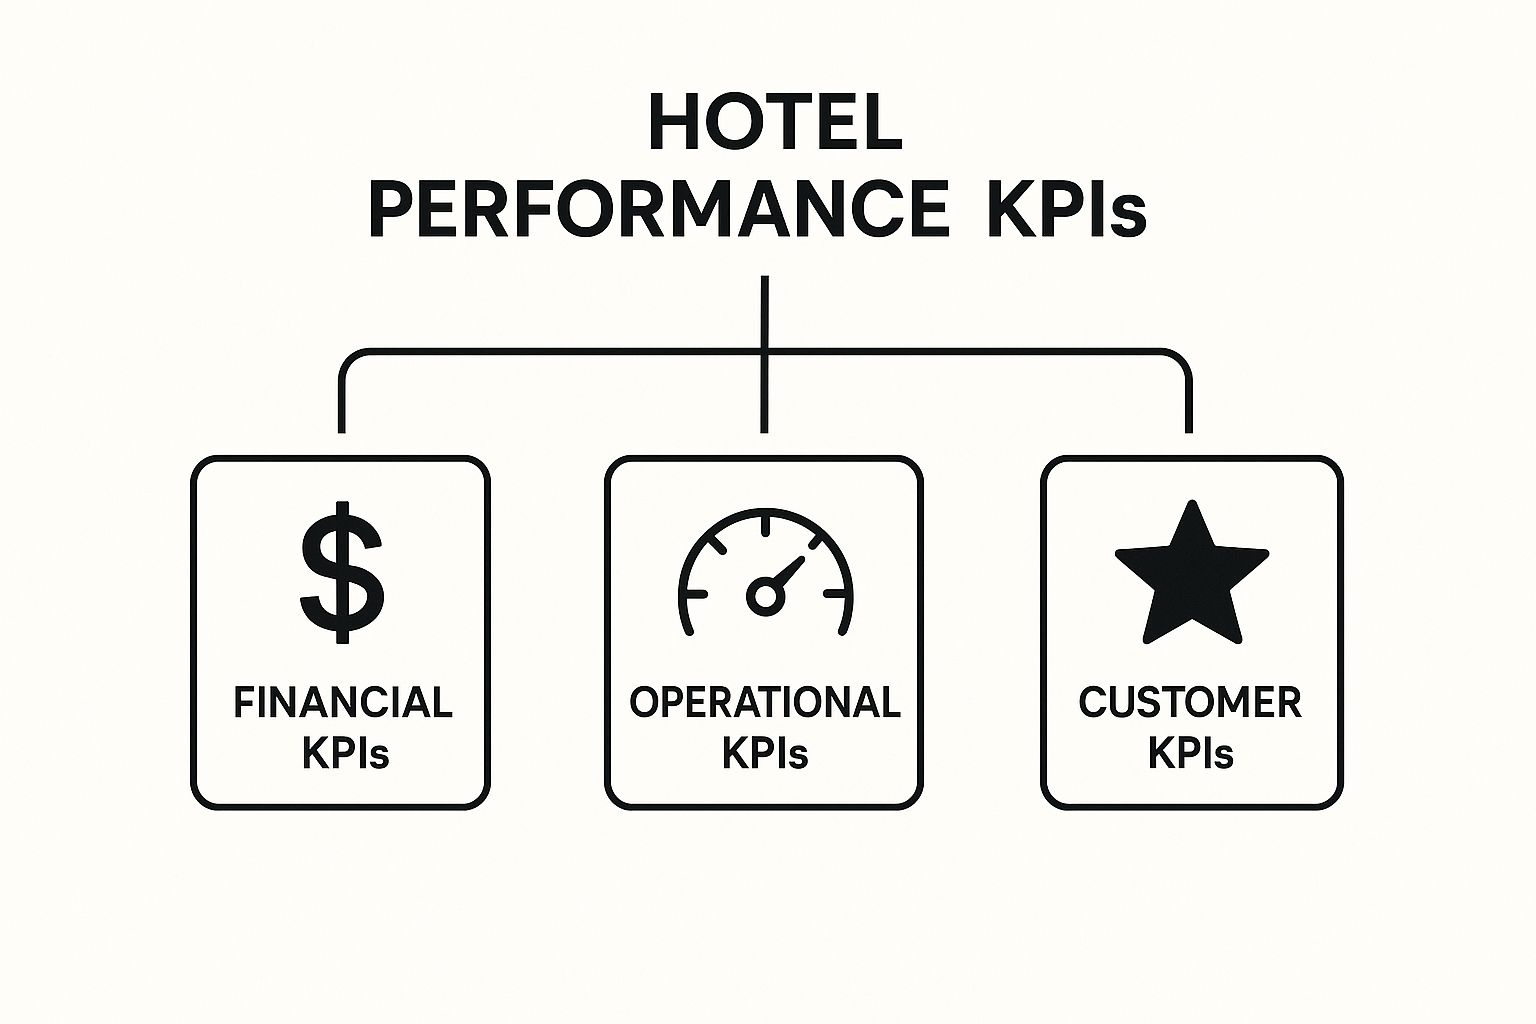
The infographic above shows how hotel KPIs are interconnected, much like the different systems in your car. Financial KPIs, like RevPAR (Revenue Per Available Room), tell you how much money you're making. Operational KPIs, such as occupancy rate, reveal how efficiently you're running your hotel. Customer KPIs, like guest satisfaction, measure how happy your guests are with their stay. Just as a smooth-running engine contributes to fuel efficiency, positive guest experiences drive financial performance.
Let's say two hotels have similar occupancy. Hotel A charges higher rates because of glowing online reviews and repeat guests – a direct result of focusing on customer satisfaction. But perhaps Hotel A also has higher staff costs, impacting operational efficiency. This highlights the need for a balanced approach, optimizing all aspects of performance.
Why KPIs Matter: Beyond the Numbers
Hotel KPIs aren't just about collecting numbers; they're about understanding the story those numbers tell. They reveal your hotel's strengths and weaknesses, enabling you to adapt to market dynamics and fine-tune your strategies. KPIs are like your headlights, illuminating the path ahead and helping you avoid obstacles. They allow you to spot emerging trends, identify areas for improvement, and ultimately, make smarter business decisions. This leads to higher profits, happier guests, and a stronger competitive edge.
To help understand the varying importance of KPIs for different properties, let's take a look at the following table:
Primary vs Secondary Hotel KPIs
Comparison of essential hotel KPIs and their importance levels for different property types
This table illustrates how the focus on certain KPIs can shift depending on the type of property. While RevPAR is crucial for most hotels, a luxury hotel might prioritize NPS as a key indicator of brand health. Similarly, a resort with extensive F&B offerings would place more emphasis on RevPASH.
From Data to Action: Building a KPI-Driven Culture
Using KPIs effectively isn't just about gathering data; it's about fostering a culture where data informs every decision. This involves setting clear targets, regularly reviewing performance, and crafting action plans based on the insights you gain. Think of it like using your car's navigation system. You input your destination (your goals), monitor your progress along the way, and adjust your route as needed based on traffic conditions (market changes).
Imagine your KPIs predict a drop in bookings during the off-season. This foresight allows you to launch targeted promotions or offer special packages to minimize potential revenue loss. This proactive approach is the hallmark of a KPI-driven hotel. By consistently analyzing data and responding strategically, you can effectively navigate the ever-changing landscape of the hospitality industry and steer your property towards lasting success.
RevPAR Mastery: The Metric That Tells Your Real Story

Revenue Per Available Room (RevPAR) is arguably the most important KPI for hotels. Think of it as the heartbeat of your hotel’s financial performance. It's the key metric that tells you how effectively you're generating revenue from your available rooms. While the formula is simple (Average Daily Rate x Occupancy Rate), understanding its nuances is crucial.
Imagine two hotels, both at 80% occupancy. One charges $100 per night, the other $150. The second hotel, despite having the same occupancy, enjoys a significantly higher RevPAR. This underscores the delicate balance between occupancy and Average Daily Rate (ADR). Filling every room isn't always the best strategy if it comes at the expense of your ADR.
RevPAR in the Wider Hotel Landscape
The hotel industry relies heavily on RevPAR as a benchmark. It's the common language everyone speaks when discussing performance. Looking at the industry’s recovery after disruptions, like the pandemic, provides valuable lessons. Bismart's Hotel Industry Insights Report delves deeper into these dynamics.
For example, global RevPAR was projected to grow by 3% in 2024, exceeding pre-pandemic levels by 13.2%. But even with this positive trend, rising costs, such as insurance (up 15.3% through October 2024), require careful attention to profitability.
Beyond the Basics: RevPAR as a Predictive Tool
RevPAR isn’t just about reflecting past performance; it’s a powerful predictive tool. Think of it as an early warning system for market changes. Experienced revenue managers use RevPAR fluctuations to anticipate shifts in guest behavior, competitive pressures, and even broader economic trends months in advance.
A sudden dip in RevPAR during what’s typically a peak season could signal several things. Perhaps a new competitor entered the market, or a major local event got canceled. By catching this early warning, hoteliers can proactively adapt their pricing, launch targeted promotions, or explore new guest segments.
Benchmarking for Success: Finding Your True Competitive Set
Comparing your RevPAR to the industry average isn’t enough. True competitive analysis involves identifying your hotel's specific competitive set. These are the hotels directly vying for the same guests. They might have similar amenities, price points, or locations – not necessarily the same star rating.
Analyzing your competitors’ RevPAR, and how it relates to market trends, gives you a powerful edge. If your RevPAR is growing slower than your competitors', it might be time to rethink your pricing strategy or invest in upgrades to boost your appeal. Continuous RevPAR monitoring and analysis empowers you to make data-driven decisions for sustainable growth and market leadership.
Let's look at some RevPAR benchmarks across different hotel segments to get a clearer idea of the current landscape and growth projections.
RevPAR Performance Benchmarks by Property Type
Current RevPAR benchmarks and growth projections across different hotel segments
Note: These are example figures for illustrative purposes. Actual benchmarks will vary based on market and specific location.
As you can see, luxury properties command the highest RevPAR, followed by the upscale segments. Economy properties face the most pressure, often needing innovative strategies to boost their performance. Understanding these benchmarks helps you position your property effectively and set realistic goals for growth.
Occupancy and ADR: The Strategic Balance That Makes or Breaks Revenue
A packed hotel might seem like the ultimate goal, but a high occupancy rate doesn't always equal maximum profit. Think of occupancy and Average Daily Rate (ADR) as two ends of a seesaw. To keep it balanced, one must adjust in relation to the other. This section explores how to find the perfect equilibrium for your property.
The Seesaw Effect: Balancing Occupancy and ADR
Imagine a hotel during a major music festival. Demand surges, allowing the hotel to command top dollar for its rooms. Even if a few rooms remain unsold, the higher ADR can boost overall revenue.
Conversely, during the quiet off-season, a lower rate can attract budget-conscious travelers, filling more rooms and compensating for the lower ADR. This illustrates the dynamic relationship between these two critical hotel KPIs.
Let's look at a practical example. A 100-room hotel with 90% occupancy at $100 ADR generates $9,000. However, if occupancy drops to 80% but ADR climbs to $120, revenue actually increases to $9,600. The key takeaway? Maximizing revenue isn't about filling every single room, but rather about finding the right balance between occupancy and rate.
Seasonal Shifts: Adapting Your Strategy
Just like the weather, seasonal trends greatly influence the occupancy-ADR balance. During peak season, prioritizing ADR often makes the most sense. But during quieter periods, attracting guests with special offers and promotions can keep those rooms filled and revenue flowing.
This requires a flexible approach to pricing and inventory. Dynamic pricing, a technique used by savvy revenue managers, involves adjusting rates based on real-time demand and market conditions, much like airlines adjust ticket prices.
Finding Your Sweet Spot: The Optimal Occupancy Level
Every hotel has its own unique "sweet spot" – an optimal occupancy level where revenue peaks. This magic number depends on several factors, including operating costs, the types of guests you attract, and the overall market climate.
Pushing occupancy beyond this point could strain your resources and negatively affect guest satisfaction, while falling short means leaving potential revenue on the table. Finding your sweet spot requires analyzing historical data, consistently monitoring your hotel KPIs, and understanding the unique aspects of your property. This data-driven approach allows you to set achievable targets and design strategies to reach them.
Pitfalls to Avoid and Frameworks for Success
One common mistake is focusing too much on one metric at the expense of the other. Obsessively pursuing high occupancy without considering ADR can erode profits, while fixating on high ADR without sufficient occupancy can result in empty rooms.
To avoid these traps, build a robust revenue management strategy that considers both occupancy and ADR. This involves setting minimum and maximum rates, using dynamic pricing techniques, and keeping a close eye on market trends to anticipate changes in demand.
By grasping the interconnectedness of occupancy and ADR, and strategically balancing these two crucial metrics, you can unlock substantial revenue growth and long-term profitability. This means your hotel can not only weather market fluctuations, but truly flourish.
Guest Satisfaction: The Revenue Predictor Hidden in Plain Sight

While revenue and occupancy are important, they're not the whole story. Think of a hotel's financial performance as a tree: RevPAR and occupancy are the fruits, but guest satisfaction is the root system. Without strong roots, the tree won't bear much fruit.
The Link Between Satisfaction and Revenue
A happy guest is much more likely to return. Like a favorite restaurant you frequent, a positive hotel experience creates loyalty. Satisfied guests also act like your personal marketing team, recommending your property to friends and family and leaving glowing online reviews.
This creates a powerful cycle: happy guests lead to more bookings, which lead to higher revenue. Studies show that even a small uptick in your Net Promoter Score (NPS), a key measure of guest loyalty, can result in a noticeable revenue increase down the line. For a deeper dive into guest surveys, check out our guide on guest experience surveys.
Measuring What Matters: Key Satisfaction KPIs for Hotels
Different hotels prioritize different satisfaction metrics. A luxury resort might focus on online reviews, while a budget hotel might track repeat guest rates. It's like using different tools for different jobs. Here are some essential KPIs to consider:
- NPS: Measures how likely a guest is to recommend your hotel. Think of it as a word-of-mouth indicator.
- Online Review Ratings: These reflect public perception and heavily influence booking decisions. They're like your hotel's report card.
- Repeat Guest Percentage: This shows how well you retain guests. A high percentage means your guests enjoy coming back.
- Customer Satisfaction Score (CSAT): This provides a direct measure of guest happiness with specific parts of their stay, like the check-in process or the cleanliness of their room.
Turning Insights into Action: The Power of Proactive Management
The best hotels don't just measure guest satisfaction—they use it to get ahead of potential problems. Imagine a chef tasting the soup before serving it; they can adjust the seasoning before it reaches the diners.
Similarly, by monitoring feedback and noticing recurring issues, hotels can fix problems proactively. For example, if several guests mention slow Wi-Fi, addressing it promptly can prevent a flood of negative reviews. This proactive approach improves the guest experience and protects your online reputation.
Building Guest Loyalty in a Competitive Market
In a crowded market, guest loyalty is your secret weapon. It's like having a loyal fan base that keeps coming back, regardless of what the competition is doing.
Focusing on creating positive experiences at every step, from booking to check-out, builds this loyalty. By acting on guest feedback, you show you care, encouraging repeat bookings. Loyal guests then become your biggest advocates, spreading the word and strengthening your hotel's reputation. This translates to increased revenue and a competitive edge.
Operational Efficiency: Where Smart Hotels Find Hidden Profits
Revenue is often the star of the show, but operational efficiency is the unsung hero driving profitability in the hotel business. Think of these key performance indicators (KPIs) as a financial x-ray, revealing the inner workings of your hotel and highlighting both healthy processes and potential cost drains.
Unveiling Hidden Costs: KPIs For Operational Efficiency
Imagine your hotel as a complex machine. Every gear, every lever, needs to work in harmony for optimal performance. KPIs such as labor cost per occupied room and energy costs per available room help pinpoint areas needing attention.
For example, a high labor cost per occupied room could suggest overstaffing or inefficient scheduling practices. Perhaps staff are spending too much time on tasks that could be automated or streamlined.
Similarly, high energy costs might point towards outdated equipment or wasteful habits. Are lights left on in unoccupied rooms? Is the HVAC system running constantly, even when it's not needed?
These operational KPIs aren’t just about cutting costs; they're about being smart with resources. Think of a skilled chef who uses the finest ingredients efficiently, minimizing waste while creating a culinary masterpiece.
In the same way, efficient hotels excel at providing outstanding service without unnecessary expenditure. This allows them to maintain healthy profit margins, even when the market throws curveballs.
Benchmarking and Best Practices: Learning From the Leaders
So, how can you tell if your hotel's operational KPIs are hitting the mark? Benchmarking against similar properties offers valuable insights. This means comparing your performance to industry averages and pinpointing opportunities for improvement.
Let’s say your energy consumption is noticeably higher than the average for comparable hotels. This signals a potential need to explore energy-saving initiatives, from upgrading to more efficient appliances to implementing stricter energy usage policies.
Leading hotels consistently seek ways to optimize their operations. They might introduce automated check-in/check-out systems using platforms like Opera Cloud to streamline front desk operations, or invest in energy-efficient lighting and appliances. These strategies boost efficiency without compromising the guest experience. You might be interested in: How to Improve Guest Satisfaction.
From Insights to Action: Real-World Examples of Operational Improvement
The true power of operational efficiency is best seen in real-world scenarios. Consider a hotel that implemented a new staff management system, like HotSOS, for its housekeeping team. By optimizing schedules and cleaning routes, they reduced labor costs by 15% without sacrificing service quality. This directly boosted their bottom line.
Another hotel invested in a smart energy management system through a provider like Schneider Electric. By closely monitoring and controlling energy use in real-time, they cut their energy bill by 10% within the first year.
These are just two examples of how a focused approach to operational KPIs can unlock significant cost savings and contribute to a healthier profit margin. These improvements also free up resources for other important areas, like enhancing guest services or investing in targeted marketing campaigns, which ultimately strengthens the hotel's competitive edge.
Digital Performance: Your Online Revenue Engine Decoded
Your hotel website isn't just a digital brochure; it's the powerhouse of your revenue generation. The right Key Performance Indicators (KPIs) act like a compass, showing you how effectively you’re navigating the online world and how that impacts your costs and profits.
Website Conversion Rates: Turning Lookers into Bookers
Imagine your website as a welcoming lobby. Visitors enter, browse around, and hopefully, proceed to the front desk (your booking engine). Your website conversion rate tells you how many of those visitors actually book a room. A high conversion rate means your "lobby" is well-designed and encourages guests to stay.
Let's say 1,000 people visit your website and 50 make a booking. That's a 5% conversion rate. Now, imagine bumping that up to just 6%. That seemingly small increase translates to a 20% jump in bookings—the equivalent of adding 10 more reservations.
Direct Bookings: Taking Control of Your Revenue Stream
Online Travel Agencies (OTAs) are like helpful concierges, but they charge a premium for their services. Increasing your direct booking percentage is like encouraging guests to bypass the concierge and book directly with you.
Each direct booking saves you money on OTA commissions. This boosts your profit margins and lets you build stronger relationships with your guests. Savvy hotels actively promote direct bookings with enticing website offers, loyalty programs, and personalized email campaigns.
Digital Marketing ROI: Making Every Marketing Dollar Count
Digital marketing is an investment, and like any smart investment, you need to see a return. Your digital marketing ROI measures how effectively your online campaigns, such as pay-per-click advertising or social media marketing, translate into actual bookings.
Suppose you spend $1,000 on a Google Ads campaign and generate $3,000 in bookings. Your ROI is a healthy 200%. Tracking this metric helps you pinpoint which channels are performing best and fine-tune your marketing spend for maximum impact.
Emerging Digital Metrics: Keeping Your Finger on the Pulse
The digital world is constantly changing. New metrics, like mobile booking percentage and social media engagement, provide valuable glimpses into how guests behave online.
Understanding which platforms your guests prefer, what content they engage with, and how they interact with your hotel online allows you to refine your digital strategies and strengthen your online presence. For a deeper dive into managing your online reputation, check out our guide on hotel reputation management.
Optimizing Your Digital Presence: Building a Smooth Booking Journey
By carefully monitoring and analyzing these digital KPIs, you can create a more efficient and profitable guest acquisition funnel. This means attracting more visitors to your website, converting them into direct bookers, and ultimately, maximizing your hotel's revenue potential.
Building Your KPI Command Center: From Data to Decisions
Imagine your hotel's Key Performance Indicators (KPIs) as the instruments on a plane's dashboard. They provide crucial information, but only become truly valuable when understood and acted upon. This section will guide you on how to build a KPI monitoring system that transforms raw data into informed decisions, helping your hotel soar.
Setting the Stage: Establishing Benchmarks and Reporting Rhythms
Think of a successful gardener. They don't just plant seeds and hope for the best. They carefully monitor growth, adjusting watering and sunlight as needed. Similarly, your hotel needs a regular rhythm for checking its KPIs, comparing them against realistic benchmarks tailored to your specific property and market.
How often should you check? Like a doctor monitoring a patient’s vital signs, the frequency depends on the situation. Weekly or monthly check-ups on core KPIs like RevPAR and occupancy might be sufficient for general health. However, more frequent monitoring – perhaps daily – might be necessary for metrics like online reviews, enabling quick responses to guest feedback and preventing small issues from escalating.
Avoiding Analysis Paralysis: Focusing on Actionable Insights
Imagine a chef with mountains of ingredients but no recipe. Similarly, collecting heaps of data without a clear plan leads to analysis paralysis. It’s overwhelming and ultimately useless.
Instead, focus on the KPIs that directly impact your specific business goals. If you're aiming to boost direct bookings, prioritize website conversion rates and the return on investment from your digital marketing efforts. If guest loyalty is your focus, then metrics like Net Promoter Score (NPS) and online reputation become paramount.
Tools and Techniques: From Spreadsheets to Sophisticated Software
Tracking KPIs doesn't have to break the bank. For smaller properties, a simple spreadsheet can be a surprisingly powerful tool. Think of it as a reliable hand-written ledger – it gets the job done.
However, as your hotel grows, consider investing in a dedicated KPI dashboard or a comprehensive Property Management System (PMS) like Cloudbeds. These tools automate data collection and analysis, providing more sophisticated insights. They're like upgrading from a basic calculator to a powerful computer – offering greater speed, efficiency, and capabilities.
Communicating KPIs: Sharing the Story With Your Team
KPIs shouldn’t be locked away in a vault. Sharing them with your team creates a data-driven culture, like a sports team where everyone knows the score and their role in achieving victory.
Regularly communicating KPI trends, both the wins and the losses, helps everyone understand how the hotel is performing. This shared understanding fosters a sense of ownership and empowers staff to contribute to improvements.
Transforming Your Dashboard into a Decision-Making Tool
When used effectively, your KPI command center becomes a powerful navigation system, constantly guiding you towards opportunities and alerting you to potential challenges. By consistently monitoring, analyzing, and acting upon your KPIs, you can steer your hotel toward sustained growth and profitability.
Ready to elevate your hotel's reputation and revenue? Discover how Ranova, the AI-powered reputation management platform, can transform guest feedback into actionable insights. Explore Ranova today.
Start now and turn guest feedback into
unmatche
d experiences
.png)
.svg)
.svg)