Content
KPI's for Hotels: Boost Revenue & Guest Loyalty

In the hotel world, we often talk about having a “gut feeling” for the business. While that experience is incredibly valuable, running a hotel on intuition alone is like trying to navigate the open sea without a compass. It’s a risky gamble. Data gives you the clarity to steer your property through choppy market waters and towards real, sustainable growth.
That’s where Key Performance Indicators, or KPIs for hotels, come in. Think of them as your essential navigation tools.
Why Your Hotel Needs More Than Just a Gut Feeling

Just as a ship's captain relies on precise instruments and charts, a sharp hotel manager needs KPIs to turn a sea of raw data into a clear roadmap for success. These metrics pull you out of the realm of guesswork and allow you to pinpoint exactly what’s working, what isn’t, and where your biggest opportunities are hiding.
To get a truly holistic view, it helps to group hotel KPIs into a few core areas. Each one gives you a different, vital perspective on your business's health.
The Foundation of Smart Decisions
To get a complete picture of your hotel's performance, you need to look at your business from a few different angles. We typically break down hotel KPIs into three main categories:
Financial KPIs: This is all about the money—revenue, profitability, and how well you're managing costs. These metrics form the financial backbone of your operation.
Operational KPIs: These measure the nuts and bolts of your day-to-day. Think front desk efficiency, housekeeping turnaround times, and maintenance requests.
Guest-Focused KPIs: This is where you quantify the guest experience. How happy are they? Are they coming back? These metrics are critical for building a loyal customer base and a strong reputation.
Tracking a balanced mix of these indicators is more important than ever. The industry is seeing a strong recovery, with major players like RIU Hotels reporting record revenues that have shot past €4 billion. In the U.S. alone, hotel occupancy is on the rise, and so is the Average Daily Rate (ADR). You can dig into more hospitality industry statistics to see just how much opportunity is out there.
Relying on a blend of financial, operational, and guest-focused metrics ensures that no single aspect of your business is overlooked. High revenue is fantastic, but not if it comes at the expense of collapsing guest satisfaction or runaway operational costs.
Before we dive deep into the specific formulas and strategies for each metric, here's a quick reference table to get you started. It lays out the most common KPIs hoteliers rely on every day.
Quick Guide to Essential Hotel KPIs
KPI Category | Key Metric | What It Measures |
|---|---|---|
Financial | Average Daily Rate (ADR) | The average revenue earned per occupied room on a given day. |
Financial | Revenue Per Available Room (RevPAR) | The total revenue generated per available room, regardless of occupancy. |
Financial | Total Revenue Per Available Room (TRevPAR) | The total hotel revenue (rooms, F&B, spa) per available room. |
Operational | Occupancy Rate | The percentage of occupied rooms out of the total available rooms. |
Operational | Average Length of Stay (ALOS) | The average number of nights guests stay at your hotel. |
Guest-Focused | Guest Satisfaction Score (GSS) | A measure of how happy guests are with their stay, usually from surveys. |
Guest-Focused | Net Promoter Score (NPS) | The likelihood of guests recommending your hotel to others. |
This table is just the starting point. In this guide, we'll break down the most important KPIs you should be tracking, complete with definitions, formulas, and real-world advice for monitoring and improving them. Whether you're running a boutique inn or managing a large-scale resort, mastering these numbers is the key to exceptional results.
If you're ready to see how these KPIs can be applied directly to your property, feel free to schedule a complimentary 30-minute consultation with our team.
Your Financial Foundation: Occupancy, ADR, and RevPAR
Before you can build a truly profitable hotel, you have to get a handle on the big three financial metrics: Occupancy Rate, Average Daily Rate (ADR), and Revenue Per Available Room (RevPAR). These aren't just abstract numbers on a spreadsheet; they are the absolute cornerstones of your entire revenue strategy.
Think of them like the vital signs a doctor checks. Each one tells a critical, yet different, part of the story about your hotel's financial health. When you look at them together, you get a powerful, at-a-glance snapshot of your property's performance. Getting comfortable with how they work, both on their own and together, is the first real step toward making smarter decisions for your business.
Let’s break them down.
Gauging Your Popularity with Occupancy Rate
The Occupancy Rate is the most straightforward way to see how popular your hotel is. It simply tells you what percentage of your rooms were actually sold on any given night. A high occupancy rate is a great sign of strong demand. On the other hand, a low rate can be an early warning that you might need to rethink your marketing or pricing.
The calculation is as simple as it sounds:
Occupancy Rate = (Total Rooms Sold / Total Rooms Available) x 100
So, if your hotel has 150 rooms and you sold 120 of them last night, your occupancy rate was 80% (120 ÷ 150 x 100). This single number gives you a direct pulse on how well you're filling the house.
Occupancy is also a fantastic benchmark for seeing how you stack up against your local competitors and the wider market. As global hotel occupancy rates are expected to be around 68% to 70%, knowing where you stand is more important than ever.
Defining Your Value with Average Daily Rate (ADR)
While occupancy tells you how many rooms you sold, the Average Daily Rate (ADR) tells you how much money you made from them. It’s the average price paid for each room sold, giving you a crystal-clear picture of your pricing power in the market. A rising ADR is often a tell-tale sign of a strong brand and smart pricing.
The formula is just as direct:
ADR = Total Room Revenue / Number of Rooms Sold
Let's say those 120 sold rooms brought in $18,000 in revenue. Your ADR for that day would be $150 ($18,000 ÷ 120). Every hotelier wants to push their ADR higher, but it’s a delicate balancing act. If you push prices too high, you risk watching your occupancy drop. The real skill is finding that sweet spot. If you want to dive deeper, there are plenty of ways you can learn how to improve hotel revenue without scaring away your guests.
The Ultimate Metric: Revenue Per Available Room (RevPAR)
This brings us to Revenue Per Available Room (RevPAR). I'd argue this is the most important metric of the three because it brilliantly combines both Occupancy and ADR into one comprehensive number. RevPAR tells you how much revenue you're making from every single room you have, whether it was sold or sat empty.
This makes it the ultimate health check for your hotel's ability to generate room revenue. It answers the one question that matters most: How good are you at filling your rooms at the best possible price?
There are two ways to calculate it:
RevPAR = Total Room Revenue / Total Available Rooms
RevPAR = Average Daily Rate (ADR) x Occupancy Rate
Using our ongoing example, $18,000 in revenue divided by 150 available rooms gives us a RevPAR of $120. Or, you could take your $150 ADR and multiply it by your 80% occupancy—you still get $120. The consistency shows how interconnected these metrics are.
This chart really brings home how these three KPIs work together.
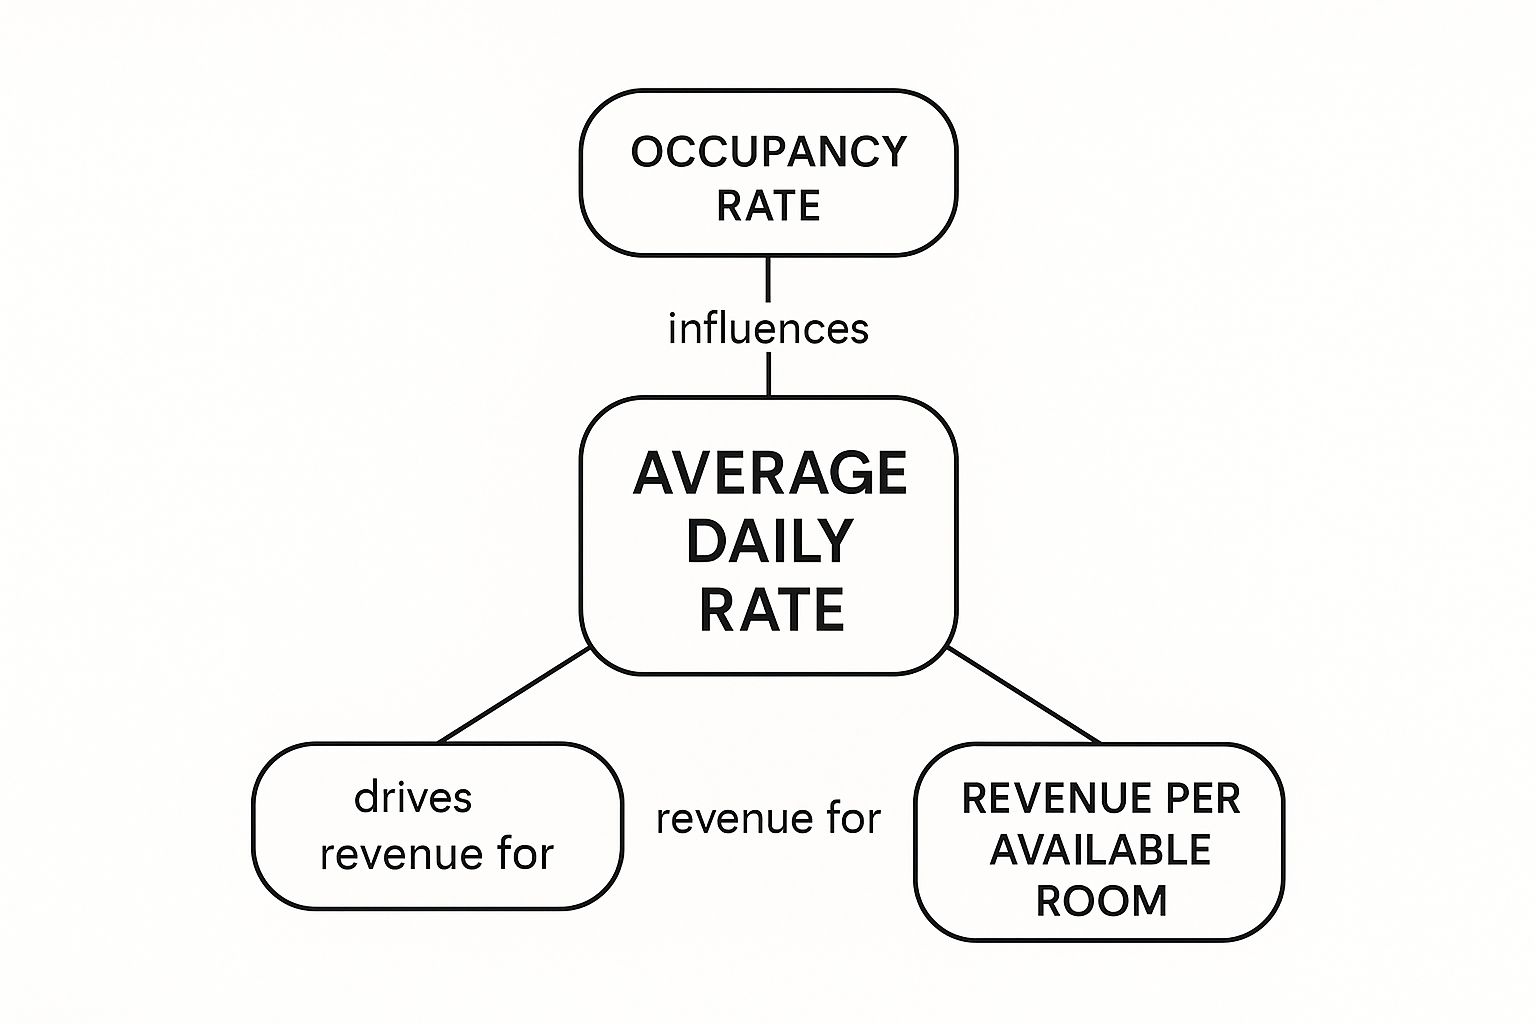
As you can see, RevPAR is the direct result of your occupancy and your average rate. You can't just focus on one; you have to manage both to truly succeed. Getting these foundational KPIs right is non-negotiable for any serious hotel operator.
Looking Beyond Revenue to Real Profitability

It’s easy to get excited by big revenue numbers from metrics like RevPAR, but those figures only tell half the story. The real measure of a hotel's success isn't just the money coming in the door; it's about how much of that money you actually keep. This is where we shift from top-line vanity metrics to the kpis for hotels that reveal your true financial health.
Focusing only on revenue can be dangerously misleading. Sure, you might be filling every room, but if your operating costs are quietly spiraling out of control, your profitability is taking a nosedive. To get an honest, clear-eyed view of performance, you have to track the metrics that account for your expenses.
Meet the Sibling to RevPAR: GOPPAR
If RevPAR shows your ability to generate room revenue, think of Gross Operating Profit Per Available Room (GOPPAR) as its wiser, more insightful older sibling. GOPPAR gives you a much fuller picture. It doesn't just look at room sales; it tallies up all revenue streams and, crucially, subtracts the costs you incurred to earn that income.
This KPI provides a far more complete assessment of your hotel's performance because it forces you to look at operational expenses. It directly answers the most critical question: after paying for the day-to-day operations, how much profit are we actually making from each available room?
GOPPAR = Gross Operating Profit (GOP) / Total Available Rooms
The magic ingredient here is the Gross Operating Profit (GOP). You find it by taking your hotel's total revenue (from rooms, F&B, the spa, parking, etc.) and then subtracting your departmental and operational expenses. What’s left is the profit your hotel generated before fixed costs like rent, property taxes, or insurance are factored in.
Calculating Your True Operational Profit
Let's quickly walk through calculating your Gross Operating Profit. It’s a straightforward, two-step process that gives you a clean look at your hotel’s financial engine.
Calculate Total Revenue: Add up every dollar your hotel brought in. This includes room sales, restaurant and bar receipts, meeting room rentals, spa services, and any other income source.
Subtract Operating Expenses: From that total revenue, subtract the costs directly tied to running those departments. This covers everything from staff salaries and the cost of food in your restaurant to laundry services and utility bills.
The number you end up with is your GOP. Divide that by your total available rooms, and you have your GOPPAR—a powerful gauge of how well you're balancing revenue generation with cost control across the entire property. A strong GOPPAR is a sign of a well-oiled, financially sound operation.
Pinpointing Financial Leaks with CPOR
While GOPPAR gives you that high-level view of profitability, Cost Per Occupied Room (CPOR) is your magnifying glass for expenses. This metric calculates the average cost of servicing a single occupied room, making it an indispensable tool for any manager who's serious about cost control.
CPOR tells you exactly how much you spend for every single guest who stays the night. This includes a whole range of variable costs you might not always think about:
Housekeeping supplies like cleaning chemicals and guest toiletries
In-room amenities such as coffee, tea, and bottled water
Laundry expenses for all the linens and towels
The electricity and water consumed in that specific room
A portion of front desk and housekeeping labor costs
Calculating it is simple. Just add up all the costs from your rooms department for a given period and divide that by the number of rooms you actually sold.
CPOR = Total Rooms Department Costs / Number of Rooms Sold
By keeping a close eye on CPOR, you can spot financial leaks that would otherwise go unnoticed. Is your CPOR creeping up month over month? That's a red flag telling you it's time to investigate. Maybe a supplier raised prices, your team is being a bit too generous with supplies, or your utility usage is out of line. Monitoring this metric empowers you to make smarter purchasing decisions, find new staff efficiencies, and ultimately protect the revenue you work so hard to earn.
Ready to get this kind of clarity for your hotel? Schedule a chat with us to see how you can automate these calculations and get back to focusing on what matters most.
Measuring the Heartbeat of Your Hotel: Guest Satisfaction
https://www.youtube.com/embed/xVbJDYMkjHY
While financial metrics like GOPPAR and CPOR are essential for understanding your hotel's financial health, they only tell half the story. The other, more human side is all about guest satisfaction. These metrics are vital because they turn subjective feelings—how a guest felt about their stay—into hard data you can use to make real improvements.
Think of it this way: your financial numbers are lagging indicators. They tell you what happened last month or last quarter. Guest satisfaction, on the other hand, is a powerful leading indicator. Happy guests are the ones who come back, leave glowing reviews, and tell their friends about you, directly fueling your future revenue.
Unlocking Insights with the Net Promoter Score
One of the most straightforward yet powerful tools for measuring guest loyalty is the Net Promoter Score (NPS). Its brilliance is in its simplicity. It all boils down to asking one direct question: "On a scale of 0 to 10, how likely are you to recommend our hotel to a friend or colleague?"
Based on their responses, guests fall into one of three buckets:
Promoters (Score 9-10): These are your champions. They loved their stay and are likely to become repeat guests and vocal advocates for your brand.
Passives (Score 7-8): This group is content but not wowed. They had a good stay, but they aren't loyal and could easily be tempted by a competitor's shiny new offer.
Detractors (Score 0-6): These are your unhappy campers. Not only will they likely never return, but they might also share their negative experiences online, which can hurt your reputation.
To find your NPS, you simply subtract the percentage of Detractors from the percentage of Promoters. The result is a single, clear number that gives you a high-level snapshot of guest sentiment.
Your Digital Reputation on Review Platforms
In today's world, your online reputation is everything. What people say about you on TripAdvisor, Google Reviews, and various OTAs directly impacts the booking decisions of countless potential guests. Keeping an eye on your scores on these sites isn't just a good idea—it's a critical business function.
Online ratings aren't just feedback; they're public-facing KPIs that signal trust and quality to the world. A dip in your average star rating can have an immediate, negative effect on both your occupancy and your ability to charge a premium.
The trick isn't just to watch these ratings, but to actively manage them. That means responding to all reviews—the good and the bad—in a timely manner. More importantly, you need to dive into the comments to find patterns. Is housekeeping a recurring issue? Is the front desk team getting constant shout-outs for their amazing service? This feedback is a goldmine for identifying exactly which parts of your operation need attention. For a more structured approach, our guide on crafting an effective hotel guest satisfaction survey offers a great starting point.
As guest satisfaction solidifies its place as a top-tier KPI, looking into AI's role in empowering customer support can provide a serious advantage in service delivery and guest loyalty. The end game is turning all that qualitative feedback into tangible operational improvements. When you consistently create exceptional experiences, your guest satisfaction scores will soar, kicking off a virtuous cycle of great reviews, repeat business, and healthy revenue growth.
How Operational Efficiency Drives Success
Strong financials and happy guests don't just happen. They’re the direct result of a well-oiled machine running behind the scenes. This is where we shift our focus to the KPIs that measure how effectively your day-to-day operations are running, ensuring the entire guest journey is smooth from the moment they check in to the second they leave.
Think of it this way: metrics like RevPAR and GOPPAR are the high-level summary of your hotel's health. But operational KPIs dig into the "how" and "why." They help you spot bottlenecks, fine-tune workflows, and give your team the support they need to deliver outstanding service, time and time again. A smooth operation is the foundation for both financial success and guest loyalty.
Understanding Guest Behavior with Average Length of Stay
One of the most insightful operational metrics is the Average Length of Stay (ALOS). It’s a simple concept: on average, how many nights are guests staying with you? A higher ALOS is almost always a good thing. It often translates to lower housekeeping costs per stay, less pressure on your front desk with check-ins and check-outs, and more chances to upsell dining, spa treatments, or other amenities.
The formula is straightforward: divide the total room nights you've sold by the number of individual bookings you took.
ALOS = Total Occupied Room Nights / Number of Bookings
Knowing your ALOS helps you make smarter decisions across the board. For instance, if your ALOS is on the lower side, you might introduce a special package that offers a discount for a third or fourth night. On the flip side, a high ALOS from international visitors could be a clear sign you need to invest in more multilingual staff. With international travel roaring back—accounting for 70% of room revenue for some major alliances—understanding these guests is crucial. You can discover more about these global travel trends and how they might affect your property.
Keeping Your Property in Top Shape with Maintenance KPIs
Nothing ruins a guest's stay faster than a maintenance issue. A leaky faucet, a flickering TV, a broken air conditioner—these small annoyances can quickly turn into big problems. Tracking maintenance KPIs isn't just about keeping guests happy; it's about preventing small issues from becoming costly disasters.
A simple yet powerful metric to watch is the average time to resolve a guest request. This tracks the clock from the moment a guest reports a problem to the second your maintenance team confirms it’s fixed. A long resolution time is a direct path to a poor satisfaction score and, almost certainly, a negative online review.
By keeping a close eye on this, you can:
Pinpoint recurring problems with specific rooms or types of equipment.
Optimize your maintenance staffing to ensure you have coverage when you need it most.
Improve the communication flow between the front desk and your maintenance crew.
Of course, tracking this manually is a nightmare. This is where choosing the right Property Management System (PMS) becomes so critical. A good PMS ensures maintenance requests are logged, assigned, and tracked automatically, cutting down on delays and making everyone more accountable.
The Hidden Costs of a High Staff Turnover Rate
Your team is the heart and soul of your hotel. That's why a high Staff Turnover Rate is more than just an HR headache—it's a massive operational and financial drain. This KPI simply measures the percentage of employees who leave your hotel over a given period.
The obvious cost of high turnover is the money spent on recruiting, hiring, and training new people. But the hidden costs are often far more damaging:
Inconsistent Service: New team members naturally need time to learn the ropes, which can lead to service gaps that frustrate guests.
Lowered Morale: When good people constantly leave, it can be incredibly demotivating for the dedicated employees who stay.
A Weaker Brand: A revolving door of staff makes it impossible to build the kind of cohesive, positive culture that truly defines your hotel's brand.
By monitoring your turnover rate, you can take real steps to improve employee satisfaction. This could mean anything from offering better training and clear career paths to fostering a more supportive and respectful work environment. A stable, happy team is one of your most valuable assets—they’re the ones who create the consistently great experiences that turn first-time visitors into lifelong guests.
Want to see how you can automate the tracking of these operational KPIs? Book a free 30-minute demo and let us show you how to turn data into action.
Turning Your Hotel KPIs into Smarter Decisions

Keeping an eye on all these different metrics is a fantastic start, but let's be honest—data is just a collection of numbers until you do something with it. The real magic happens when you close the gap between knowing your numbers and using them to make confident decisions that push your hotel forward.
Let's face it, wrestling with manual spreadsheets is quickly becoming a relic of the past. It's painfully slow, riddled with potential for human error, and just can't keep pace with the hospitality industry. This is exactly why modern tools, whether a sophisticated Property Management System (PMS) or a dedicated dashboard like Ranova, are becoming indispensable.
The Power of Automated Insights
Automating how you gather and analyze your data isn't just a time-saver. It's about completely reshaping how you run your hotel. When your KPIs update in real time and are laid out in a way you can actually understand, you suddenly have a serious strategic advantage.
The benefits are immediate and obvious:
Stay Ahead of the Curve: Instead of reacting to last month's numbers, you can spot performance dips or surges the moment they happen. This lets you jump on issues before they snowball into real problems.
Free Up Your Team: Think of all the hours spent on tedious data entry. Automating that work frees up your staff to focus on what they do best—creating an unforgettable guest experience.
Trust Your Numbers: Automated systems don't have fat-finger moments or make calculation errors. You can finally trust that the data you're looking at is accurate, which leads to much sounder decisions.
The ultimate goal is to turn your data into a competitive weapon. Having these KPIs at your fingertips empowers you to spot trends, smooth out operational wrinkles, and grab revenue opportunities faster than the hotel down the street.
At the end of the day, the whole point is about turning data into actionable insights that lead to smarter, more profitable choices for your property.
From Data Points to Decisive Action
Having your most critical metrics instantly available empowers everyone, from the GM to the front desk. It changes how you tackle problems and uncovers hidden opportunities for growth. For a closer look at the specific metrics that can fuel your strategy, check out our complete guide on every essential kpi for hotels.
Picture this: your front office manager notices a sudden drop in your Net Promoter Score (NPS) after a busy weekend. With a live dashboard, they can immediately drill down into recent guest feedback, pinpoint a recurring complaint about slow check-ins, and tweak the process right then and there. That’s the difference between putting out fires and proactive, data-informed management. It’s about turning numbers into a clear roadmap for success.
Common Questions About Hotel KPIs
Diving into hotel metrics can bring up a lot of questions. Let's tackle some of the most frequent ones I hear from hoteliers, so you can start putting these numbers to work for your property.
Which Single KPI Is Most Important for a Hotel Manager?
I get this question all the time. Everyone's looking for that one magic number, but the truth is, a great hotel manager never relies on just one metric. While many people point to RevPAR as the top dog for tracking revenue, it's only telling you part of the story.
A truly savvy manager understands the need for a balanced view. Think of it like a three-legged stool. You need RevPAR to understand your top-line revenue health, GOPPAR to make sure you're actually profitable, and Guest Satisfaction Scores to build the loyalty that fuels long-term success. It's not about finding the one most important KPI; it's about seeing how they all work together to give you a complete picture of your hotel's performance.
How Often Should I Review My Hotel KPIs?
The right frequency really depends on the metric itself. You don't need to check everything every single day. A tiered approach works best, allowing you to stay on top of things without drowning in data.
Daily: This is for your immediate operational pulse. Glance at your Occupancy Rate and any new bookings. These numbers tell you what's happening right now.
Weekly: Time to look at your core revenue performance. A weekly review of your ADR and RevPAR is perfect for seeing how your pricing and sales strategies paid off over the last seven days.
Monthly or Quarterly: Save the big-picture, strategic KPIs for this review. Metrics like GOPPAR, your Net Promoter Score (NPS), and Staff Turnover Rate show their true trends over longer periods. This is where you evaluate the real impact of your strategic decisions.
This layered approach lets you be agile in your day-to-day operations while still keeping a steady hand on your long-term goals.
Where Do I Start If My Hotel Isn't Tracking Any KPIs?
If you're starting from scratch, don't feel overwhelmed. The key is to start simple. Don't try to boil the ocean by tracking two dozen metrics from day one. Instead, begin with the foundational trio that forms the financial backbone of any hotel.
You can almost certainly pull these three directly from your Property Management System (PMS) right now:
Occupancy Rate
Average Daily Rate (ADR)
Revenue Per Available Room (RevPAR)
Focus on mastering just these three. Get comfortable with the formulas, watch how they interact, and start using them to guide your decisions. Once you have a good handle on them, you can begin layering in more detailed operational and guest-focused KPIs.
Ready to stop guessing and start making data-driven decisions? Ranova centralizes your most important KPIs and turns guest feedback into a clear action plan. Schedule your personalized demo today and see how you can elevate your hotel's performance.